The detection of fractures in tight oil and gas reservoirs has received increased attention due to the production of unconventional reservoirs in recent years. While borehole image logs and core analysis have been widely used in these studies, the use of geophysics is of increasing interest due to the ability to image the effects of fractures between boreholes. This brief article proposes some directions for geophysical research in order to aid in enhanced oil production of tight oil and gas reservoirs.
While CHORUS is a group that has focused on heavy oil, many of the CHORUS methods can be used in geophysical characterization of all unconventional reservoirs.
In past years, it was recognized that fractures would cause anisotropy in seismic recordings from shear-wave sources. A shear-wave impinging on a fracture would split into a fast and slow shear-wave through a process known as shear-wave splitting or birefringence. This was demonstrated by Alford (1986) who used directed shear-wave sources and multicomponent receivers to analyze fast and slow shear-waves. Figure 1 (from Sheriff, 1991) illustrates this splitting.
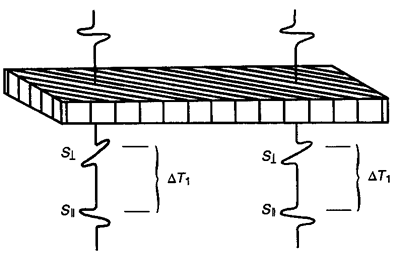
Figure 1. This figure, from Sheriff (1991), describes S-wave splitting (birefringence) into fast and slow modes upon encountering vertical fractures.
The size of the time difference of fast and slow arrivals,

is governed by the density of fractures. The directions of displacements of the fast shear (parallel to fractures) and the slow shear (perpendicular to fractures) are governed by the orientation of fractures.
While shear-wave data is useful,
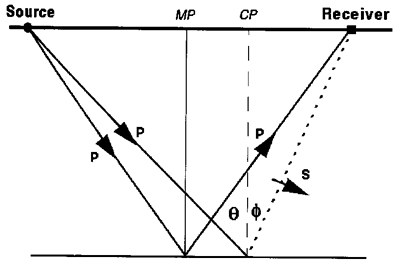
Figure 2. A description of P-S converted waves, from Stewart et al. (2002)
the use of directed shear-wave sources with multicomponent recording is not common. The standard mode of seismic acquisitions uses P-wave sources such as air gun (marine), dynamite (land) and vibroseis (land) which primarily generate P-waves. The analysis of shear-wave energy primarily comes from the use of converted waves, in addition to P-waves, as shown in Figure 2.
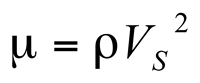
The use of seismic data for fracture detection is derived primarily from the estimation of elastic constants: bulk modulus of incompressibility (k), shear modulus of rigidity (µ), Young's Modulus (E), and Poisson's ratio (v). For isotropic media, any two of these elestic constants with rock density, p, can be used to derive the full set of constants. (See Figure E-6 from Sheriff (1991, p. 100)). The most straight forward measurements to derive these constants come from the measurements of P-wave and shear-wave velocities. The P-wave velocity, V
P and the shear-wave velocity, V
S can be expressed in terms of k and µ by:
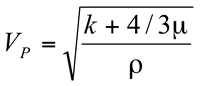
(1)
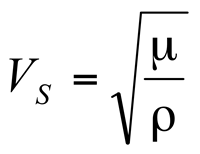
(2)
Therefore,
(3)
and
(4)
While these constants k and µ represent the incompressibility and rigidity of rocks,
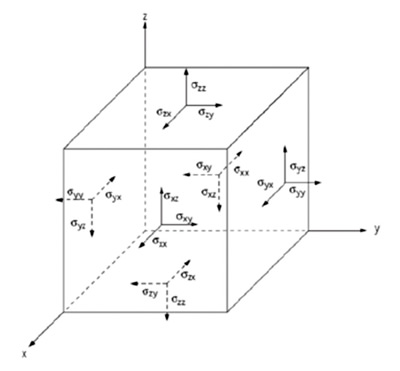
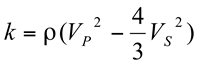
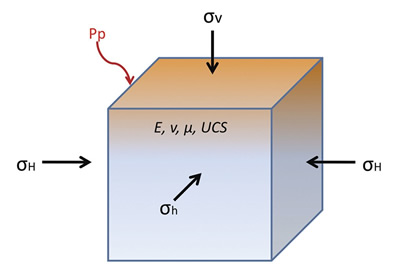
Figure 3. Figure showing 3-D stress tensor components (originally from Jaeger and Cook, 2007)
the characterization of fractures can possibly be better understood with the use of Young's modulus and Poisson's ratio. To understand this, it is useful to reference a lucid paper by Wikel (2011). To understand fractures and elastic constants, it is useful to consider the stress tensor within the earth, as depicted in Wikel's paper.
The stress tensor can be described by a 3 by 3 matrix
whose values represent the direction of force / unit area and the orientation of the face upon which the force acts. For simple geology, this matrix can be rotated so that the shear stresses (

) vanished as shown in Figure 4.
The size of the stresses will determine the type of faulting. The three cases of normal, strike-slip and reverse faulting are given in Figure 5 from Wikel (2011).
Figure 5. The relative magnitudes of vertical, maximum horizontal, and minimum horizontal stresses will determine the type of faulting in an elastic medium from Wikel (2011).
At this point, it is useful to understand the Young's modulus and Poisson's ratio in terms of the deformation of the medium under stress. These will be the two elastic moduli that will be most descriptive for fractures.
For these purposes, we use Figure 6 from Batzle et al (2006) as an illustration of these elastic constants.
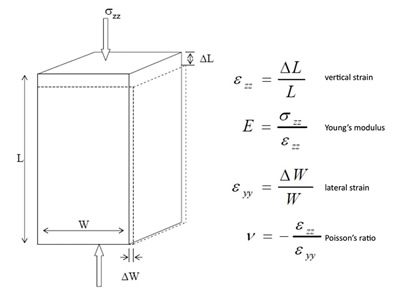
Figure 6. This diagram from Batzle et al. (2006) defines Young's modulus and Poisson's ratio in terms of stress and strain components.
We noted that Young's modulus is the ratio of extensional stress / extensional strain. This is essentially the "spring constant" for the material and it has the units of stress. A large Young's modulus will mean that a material does not stretch easily for a given stress or that it is "brittle".
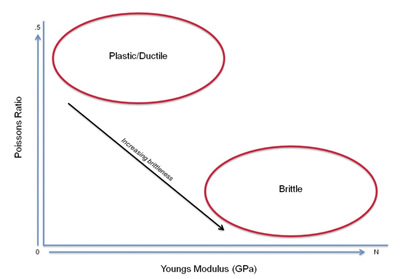
Figure 7. The relationship of ductility and brittleness of a medium are given by the size of Young's modulus and Poisson's ratio. Figure is from Rickman et al. (2008).
The Poisson's ratio is the ratio of "thinning" or decrease in lateral strain to the extension of the material (vertical strain). A large Poisson's ratio will imply that a material is ductile or plastic. Figure 7 shows how Young's modulus and Poisson's ratio relate to the brittleness and ductility of a medium.
These elastic constants of E and ν can be defined in terms of k and µ by the following relations from Sheriff (1991).

(5)

(6)
Therefore, it is important to note that if we can determine the P-wave and S-wave velocities for a medium, we can determine the Young's modulus and Poisson's ratio for the medium by the use of equations (1) - (6).
The brittleness and ductility of the medium will relate to the nature of the fractures. E will determine brittleness or how wide a fracture can be opened. A low value of E will mean that a wider crack can be opened (Wikel, 2011). The ductility or plasticity will determine whether or not fractures can be easily formed.
The values of k and µ can be estimated through kinematic velocity analysis of P and shear-waves or through AVO (amplitude variation with offset) as described by Gray et al. (2010).
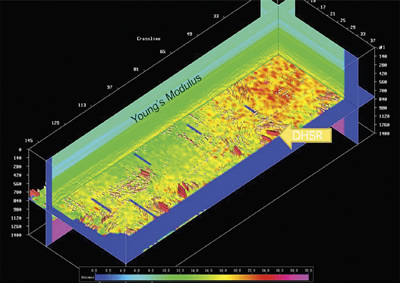
Figure 8 shows a color background of Young's Modulus on a 3-D seismic display from Gray et al. (2010)
In either case, seismic data can be used to characterize elastic parameters and consequently describe the fractured nature of the reservoir. Figure 8 (from Gray et al., 2010) shows a color background of Young's modulus on a 3-D seismic display.
 ,
,  , and
, and  respectively. This is a figure from Wikel (2011)