Seismic Modeling and Inversion
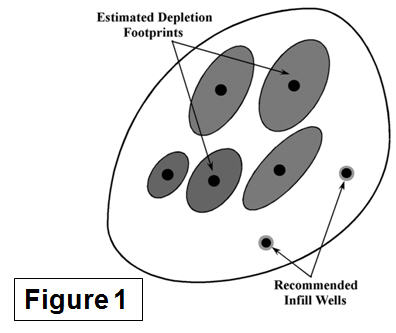
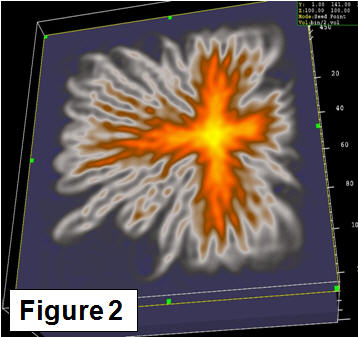
One of our first projects outlined depletion footprints to optimize locations of cold production zones (Figure 1). This is done by delineating wormhole zones of high permeability (Figure 2).
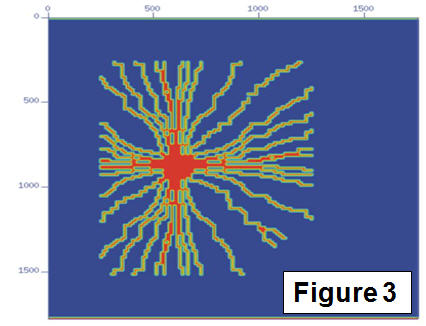
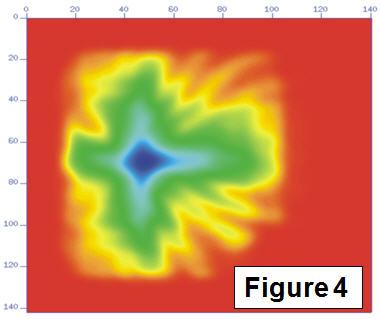
Individual wormholes are about two orders of magnitude smaller than seismic wavelengths (Figure 3) and hence cannot be effectively resolved; however we can effectively define the edge of wormhole zones (Figure 4).
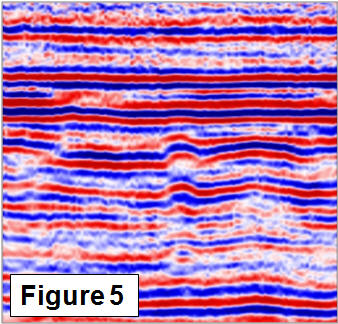
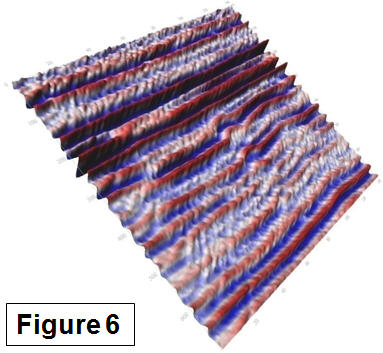
Advancements in seismic visualization have allowed conventional seismic displays (Figure 5) to be shown in Seiscape images (Figure 6).
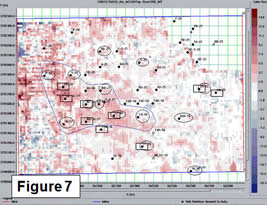
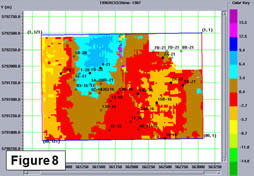
Cold oil production appears to correlate with two seismic phenomena around producing wells:
- Large seismic amplitudes at the reservoir level (Figure 7).
- Time delays in reflections below the reservoir level (Figure 8).
Avoz inversion (Amplitude Variations with Offset and Azimuth) can be useful for understanding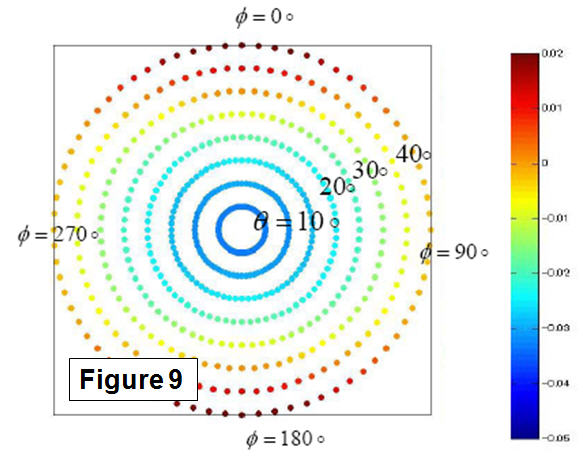 the relationship between the spreading of wormholes and stress distribution in oil sands reservoirs. In Figure 9, the color shows the amplitude, Azimuth is in degrees from North and offset is shown by radius.